E-commerce Churn Prediction Model
Objective of prediction model is to help predict future events by using existing data; the prediction made by the model then would drive decisions made in the present. This can be achieved by analysing and engineering data, then projecting the results into machine learning model. The resulting model would then be able to predict outcomes from future data. In this case the predictive model is made for an ecommerce platform.
The company behind an ecommerce platform are having problem with their overall user churn rate. The company wanted a tool to help them distinguish between high and low risk of churning users so they can apply proper actions to each group of users. Prior to designing the prediction model, there is a need to first analyse and we need to understand the users behavior and characteristics; to be able come up with a more precise model.
Note: This prediction model is the second part of a 2-part project: first part here.
Info: View the full notebook here.
Data Cleansing & Pre-Processing
Data cleansing and pre-processing are essential steps in preparing data for predictive modelling. This process purpose is to rid the data of incorrect, incomplete, improperly formatted, or duplicative data; these data are useless data or at worst misleading. When data full of ‘junk’ are being used to design a predictive model, the model itself will turn out to be a ‘junk; as many people says “Garbage in, garbage out”.
Check Duplicate Data
Duplicate datas can introduce bias into the model; since data that are supposed to be occuring only once ends up occuring more than once and weight more on the model’s calculation. This particular data have no duplicate values so the data can be left alone.
- Duplicate Rows: 0
- Duplicate Rows: 5630
Dropping Features
Having analysing the data previously in the analysis part, there are a few features that need to be preemptively removed:
- CustomerID - is a random number assigned and will introduce a random element into the model.
- Tenure - this is because keeping this feature will introduce bias in the model; since it was determined that most of the churn users are on
Tenure <=2its important to be able to predict the users’ churn probability as earlu as possible regardless of their tenure. - DaySinceLastOrder - a feature that indirectly also defines users’ tenure; as it is the opposite of tenure.
Dealing With Missing Values
The data have some features with missing value that needs to be addressed. Firstly it is possible to just drop all the missing value row and check if the row reduction would be too much or not.
- Rows before drop: 5630
- Rows left after drop: 4345
- Data Shrinkage: 22.82 %
Dropping all rows with missing value reduces the data size by 28.28%; which is too much so another treatment for missing values need to be done. Since all the missing values are on numerical columns, there are two choices, to fill all missing values with mean or median. With some of the features needing an integer (rounded non-decimal numbers) CityTier or boolean feature that are defined by 0/1; most of the features’ mean and median are close to each other; for this case filling missing value with median would be more fitting. By filling missing values, the data wont experience any data shrinkage.
Outlier filter with Zscore
By definition, an outlier is an object (in this case data) that diverge substantially from the rest of the group’s average. Outliers usually introduce noises in data and often something that breaks a pattern.
It is important to take care of outlier data that are going to be used to design a predictive model. Most of the time, removing outlier value from the whole data will help improve the performance of the model; it is better to remove the outlier in this case.
The outlier filter will be using z-score. Z-scores gives a score of how many times of standard deviation the distance of the data is from its dataset average. The break point is on 3 times standard deviation, since 3 times standard deviation represents 99.7% of the whole dataset on a normal distribution data.
- Rows before outlier filter: 5630
- Rows left after outlier filter: 5380
Class Imbalance
Since this is a classification problem, there is a need to check for class imbalance on the target data. Class imbalance is where the class distribution across the data is knowned to be biased or skewed; in this case the class is the churn data.
Original data class distribution:
- Non-Churn Users: 4467
- Churn Users: 913
The target, churn/non-churn status of users, distribution is biased towards ‘non-churn’; it is 83% of the whole sample. With this bias, the ‘minority’ class could end up being ignored by the model; simply stating that all of the users as ‘non-churn’ users would result in 83% accuracy.
There are alot of different methods to deal with class imbalance issue, one of them is to oversample the data. In this case oversampling is done with SMOTE. The resulting oversampling is to equalize the data size for both classes.
Data class distribution after oversampling:
- Non-Churn Users: 4467
- Churn Users: 4467
Machine Learning Modelling
The classification methods that are going to be used are 2 of the most basic methods; Desicion Tree and Random Forest. While the scoring would be based on ‘Recall’, because for predicting churn it is important to get as high a possible of true positive prediction.
Other basic parameters for the model:
- 80/20 train/test split
- Model are based on sklearn library
Decision Tree
Train Recall: 1.0
Test Recall: 0.9357
Other tests results:
- Accuracy: 0.93
- Precision: 0.92
- Recall: 0.94
- F1-Score: 0.93
- AUC: 0.93
Random Forest
Train Recall: 1.0
Test Recall: 0.95716
Other tests results:
- Accuracy: 0.97
- Precision: 0.97
- Recall: 0.96
- F1-Score: 0.97
- AUC: 0.97
Model Tuning
Out of the 2 models, Random Forest model results in a better result out of the shelf, so the model would be based on Random Forest. However, some tuning would still need to be done. Most of the time tree based model out of the shelf tend to overfit; one clear indication is that the train score result is 100%.
Hyperparameter Tuning
The most important hyperparameter to tune in a tree based model is the max-depth. This is because on default the max-depth varibale is set to infitie (maximum) value; this lets the model to keep making new tree and leaf to cater to the diff data combinations which ends up overfitting the data. To check check what the best max-depth should be, it is possible to check by drawing a graph:
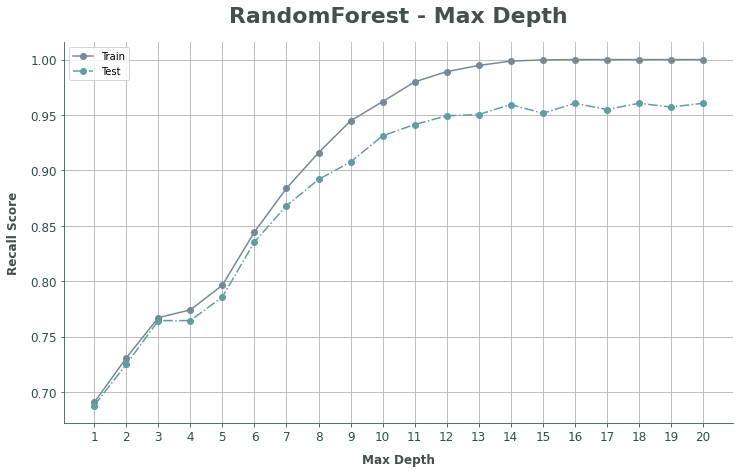
From the graph above, there are 2 important thing to observe:
- Growth of discrepancy between scores of
TrainandTestresults. For obvious reasons, train score result will often if not always be higher; but the bigger the discrepancy of both scores would indicate the model to be overfitting. - Shape of the curve; where the growth in score starts to slows down.
- Plateu-ing of the scores, where the scores stop improving.
Considering both points, the best max-depth would be n = 14.
Random Forest (Tuned)
Train Recall: 0.96201 Test Recall: 0.93123
Other tests results: Accuracy: 0.92 Precision: 0.91 Recall: 0.93 F1-Score: 0.92 AUC: 0.92
Cross Validation
To be able to check if the model is reliable, it is important to do a cross validation. One of the way is to iterate the model into multiple folds.
Folds are designed to split the train data into 2 parts; (1) data that will actually be used to train model; (2) data to validate test results. Since the original train data is 80% of the total sample, the data are split into 8 parts, each part representing 10% of the sample. Every fold iteration then will select 1 out of 8 parts in turn and designate it to be the validation data; the rest of the 7 parts are combined to be the test data. This will result in 8 different train, test, and validatin scores to be observed.
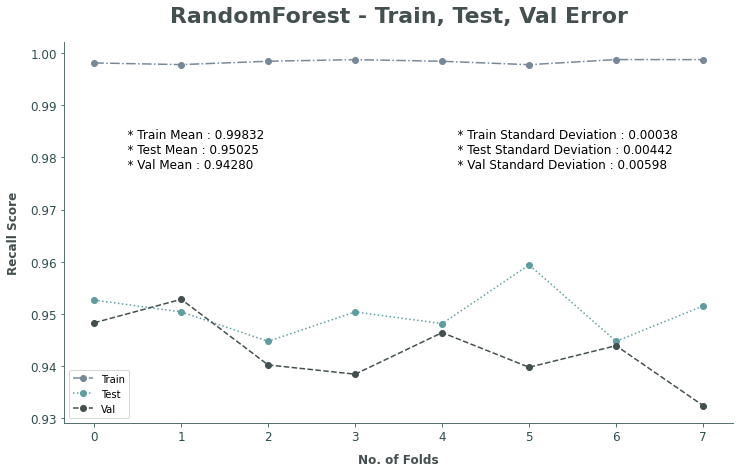
From the graph above, it is clear that the model shows constant results; which means that the model is reliable enough to be used.
Predictive Model Implications
Using the predictive model it is possible to predict whether a particular user will churn or not. Since there is no future data available to test the model with; using the existing data, albeit was used to train the model, is the only option available.
To simulate proper business implication, the test will be in a form of simulation if the model is actually being implemented.
Simulation Conditions
Since there is no context of how big the data is, or how capable the hardwares that are going to run the model, it is safe to assume that the model would be ran once a day at the end of the day.
With this condition comes a limitation to which users that could be mitigated, specifically users that churns on day 0; it is not possible to mitigate users that churn on the same day they register because the model only predict after the end of the day.
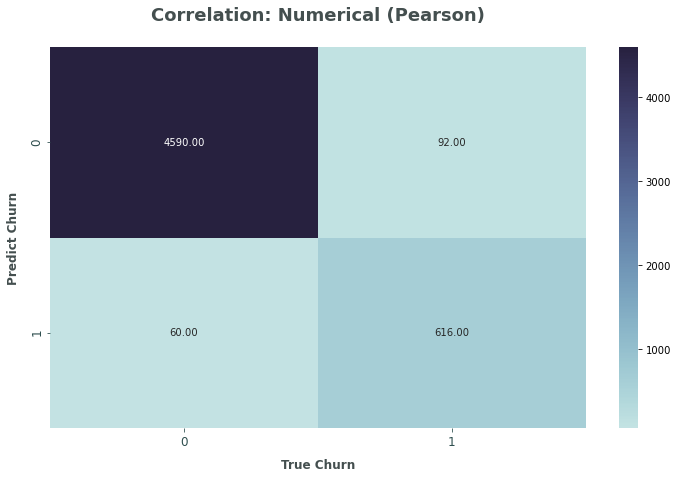
The results shows that out of all of the churn users, there are 616 correcly predicted churn users from a total of 948 churn users.
Business Impact
After being able to predict which users are at a high risk of churning, it is important to be able to follow up that information with a business actions. There are alot of different business actions that could be taken; some recommendations are given on the first part of this project. Obviously, how effective the business actions taken are yet to be known; it is possible, however, to forecast the business impact if actions taken are effective in turning possible churn users into loyal users.
For this calculation there are some assumption to be taken:
- Revenue from users are assumed from their Cashback gained (cashback is set to a 10% flat).
- Churn users average revenue: 1400000
- User’s LTV: 2200000 (minimum)
- Acquisition cost is 650000.
- Retention cost is 20% of Acquisition cost, 130000.
- Every churn users are replaced with a new user with acquisition cost.
From these assumption it is possible to forecast the business impact depending on how effective the business actions taken are.
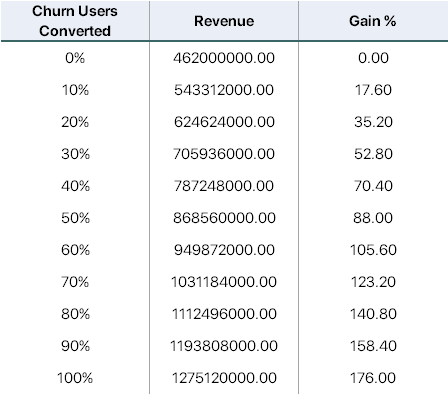
The gain in revenue for converting high-risk of churning users into loyal users are quite significant; even though it is linear, it is 17.6% growth per 10% of churn users converted. This is of course only for one month. The growth would become more significant and exponential with time passed, the growth of loyal users and LTV would stack together and increase the gain.